Mapping Digital Pathways: Insights into Connectivity and User Resources in Gaming Networks
Dana Lorenz · Jul 2, 2026
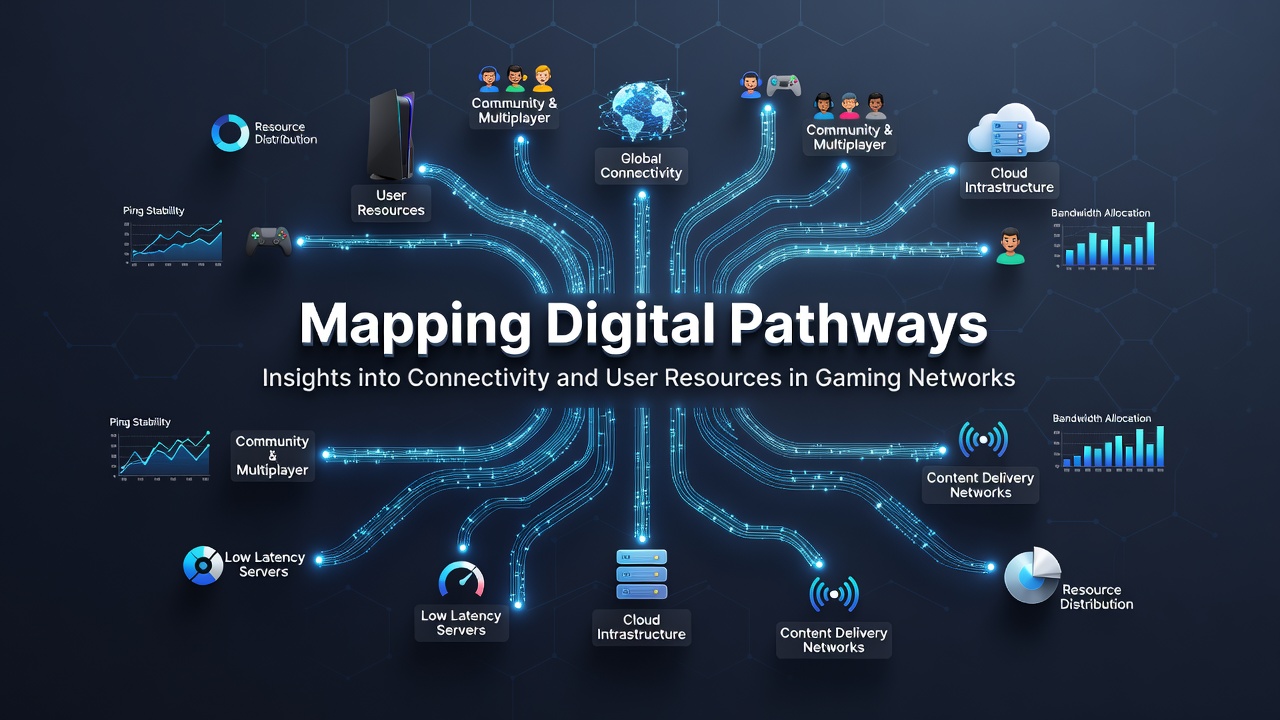
Mapping Digital Pathways: Insights into Connectivity and User Resources in Gaming Networks
Digital pathways in gaming networks trace the routes data takes between players and servers, and these routes determine how smoothly interactions unfold across platforms. Observers note that mapping these pathways reveals patterns in latency, bandwidth allocation, and resource distribution that shape everyday play sessions for millions of users worldwide.
Connectivity relies on a combination of fiber optic backbones, regional data centers, and dynamic routing protocols that adjust in real time to traffic loads. Research from the Entertainment Software Association indicates that average connection speeds for online gaming reached 85 megabits per second in North America by early 2025, while similar figures from the Australian Communications and Media Authority showed comparable growth in Oceania markets during the same period.
Tracing the Infrastructure Behind Player Connections
Server clusters positioned near major population centers reduce travel time for packets, yet the actual mapping process involves more than geography. Algorithms evaluate hop counts, packet loss rates, and current congestion levels before assigning a player to a specific node. Those who monitor these systems report that updates in July 2026 introduced enhanced predictive routing models that anticipate peak hours across time zones.
User resources extend beyond raw bandwidth and include dashboards that display connection quality metrics, troubleshooting guides tailored to common regional issues, and community forums moderated by platform staff. Data from the European Commission's digital connectivity reports highlights how such tools have helped reduce average support ticket resolution times by 22 percent in member states between 2024 and 2026.
Resource Allocation and Accessibility Tools
Many networks now provide players with interactive maps that visualize server loads and recommended connection points. These interfaces often integrate with account settings so users can prioritize stability over speed or select regions with lower player density during off-peak windows. Observers note that such features draw from real-time telemetry collected across thousands of concurrent sessions.
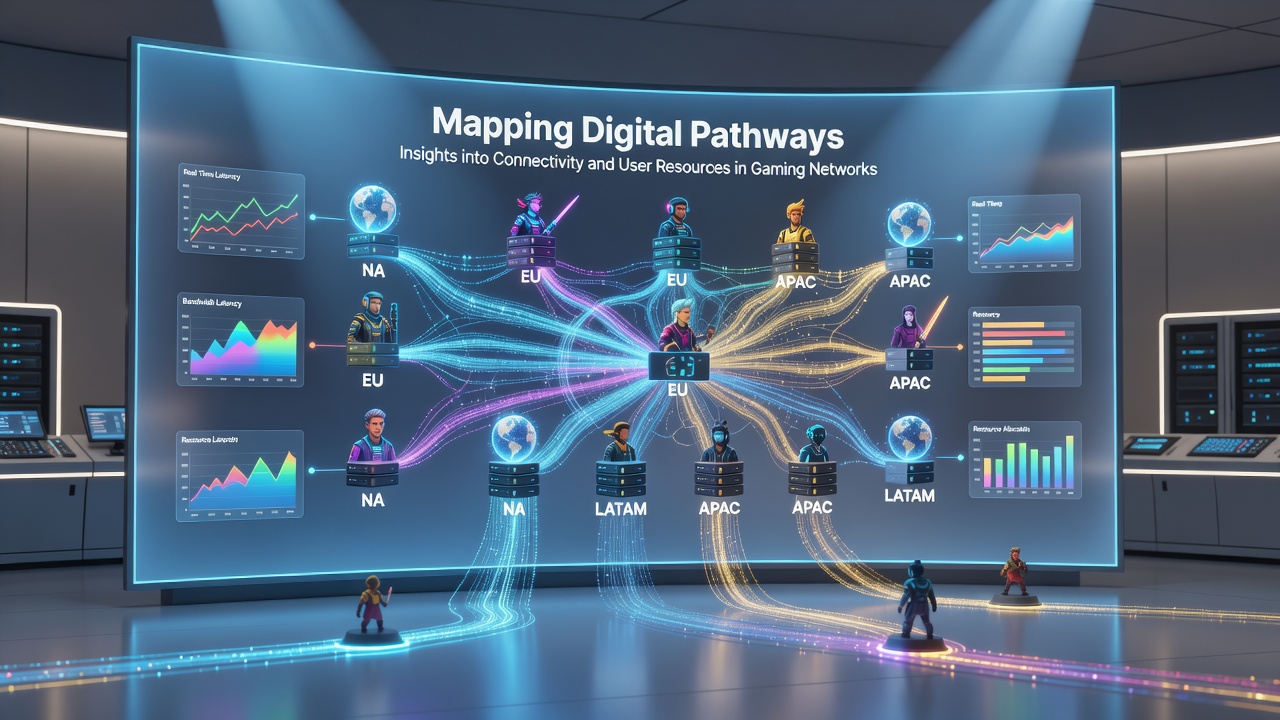
Support documentation covers topics ranging from port forwarding configurations to wireless interference mitigation, and these materials appear in multiple languages to serve international audiences. Figures from Statistics Canada reveal that multilingual resources increased engagement with official help centers by 31 percent among Canadian users during the first half of 2026.
Regional Variations in Network Mapping Practices
Differences emerge when comparing infrastructure approaches across continents. North American operators frequently emphasize edge computing nodes to shorten last-mile distances, whereas European providers focus on cross-border peering agreements that maintain consistent performance despite regulatory diversity. In Asia-Pacific regions, emphasis falls on undersea cable redundancy following expansion projects completed in late 2025.
Players access these mapped resources through in-game overlays or dedicated web portals that require secure authentication. The portals aggregate historical connection data so individuals can identify recurring issues tied to specific internet service providers or hardware setups. Turnout for webinars explaining these tools rose noticeably after platform announcements in July 2026.
Future Developments in Pathway Visualization
Emerging standards for network transparency encourage operators to share anonymized mapping data with researchers and developers. Academic studies conducted at institutions in Singapore and Sweden have begun analyzing these datasets to model congestion patterns that affect competitive play. Such collaborations produce public reports that inform both technical upgrades and player education campaigns.
Integration of artificial intelligence into routing decisions continues to evolve, allowing pathways to shift before noticeable degradation occurs. These systems rely on historical patterns combined with live sensor input from routers worldwide, creating feedback loops that refine accuracy over successive updates.
Conclusion
Mapping digital pathways provides the foundation for understanding how connectivity and user resources interact within gaming networks. The tools and documentation available today reflect ongoing investments in infrastructure visibility and support accessibility, while regional data continues to guide refinements scheduled through the remainder of 2026 and beyond.